One Level Deeper
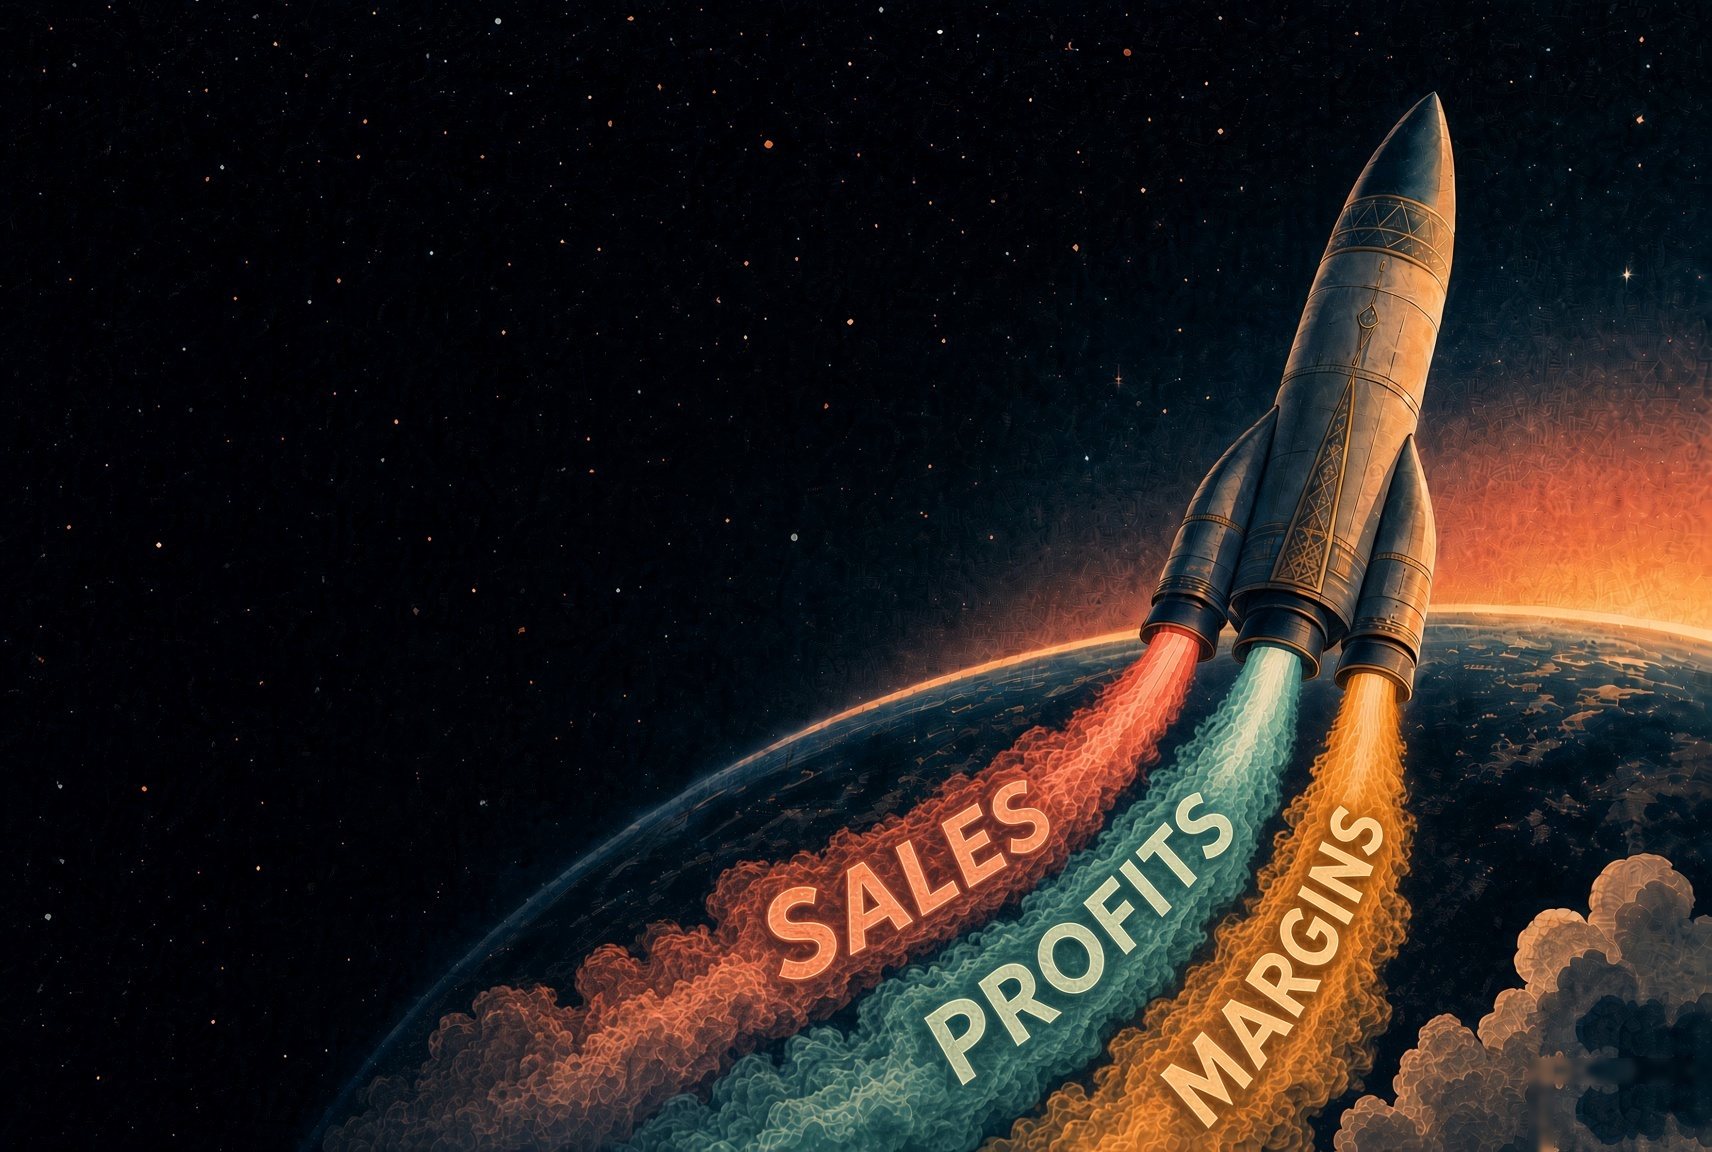
A rocket climbing over the earth on three trails of smoke, labelled sales, profits and margins
Week 1 · 31 Oct 2026 · a new list every Saturday

Finding the next multibagger.

One engine gets you off the ground. Multibaggers fire all three: sales, profits and margins, rising together.

The DNA of a multibagger

Three engines, all firing.

A stock rarely multiplies on one. Every company on this list has all three going at once.

Engine 1

Sales rising ▲

Sales this quarter at least 15% above the same quarter last year.

Every multibagger starts with more customers buying more. Comparing with the same quarter takes out festive and seasonal swings.
Engine 2

Profit rising faster ▲▲

Profit up at least 20%, and operating profit — what the business earns from its own work — up at least 20% too.

When profit grows faster than sales, each new rupee of sales brings in more than the last. Operating profit makes sure it isn’t a one-off gain.

Engine 3

Margins widening ▲

More of every ₹100 of sales kept as operating profit than in the same quarter last year.

The sign that separates a great business from a busy one: it can charge more, or it gets cheaper to run as it grows.

Cutting the noise

Nine more checks keep out the traps.

Good numbers can still mislead. Every company on the list passes these too. Tap any one to see why it is there.

All 13 checks, word for word. Paste them into your own screener and run it yourself.
This week · 62 companies pass every check

Stocks showing multibagger signs this week.

Ranked by return on capital times three years of sales growth: the ones that earn the most on their money and have grown the most come first. P/E is shown so you can judge the price yourself.

The screen finds candidates. The research comes next: where a company has a page here, its name links to the five questions answered from its own filings.

1
MCX (Multi Commodity Exchange)
Market cap ₹81,312 Cr · ROCE 71.3%
Sales+88%
Profit+103%
Margin70.4%was 64.6%
P/E52.7
2
BSE
Market cap ₹1.43 lakh Cr · ROCE 60.0%
Sales+63%
Profit+66%
Margin66.8%was 65.3%
P/E50.6
3
Emmvee Photovoltaic
Market cap ₹15,855 Cr · ROCE 44.6%
Sales+39%
Profit+61%
Margin35.33%was 35.31%
P/E11.2
4
International Gemological Inst.
Market cap ₹17,189 Cr · ROCE 69.3%
Sales+31%
Profit+43%
Margin61.4%was 58.0%
P/E25.8
5
Afcom Holdings
Market cap ₹3,664 Cr · ROCE 28.0%
Sales+48%
Profit+86%
Margin40.4%was 39.5%
P/E25.0
6
GE Vernova T&D
Market cap ₹1.03 lakh Cr · ROCE 77.4%
Sales+32%
Profit+44%
Margin27.1%was 25.8%
P/E69.5
7
Timex Group
Market cap ₹6,115 Cr · ROCE 82.8%
Sales+30%
Profit+71%
Margin16.1%was 12.8%
P/E68.5
8
SRM Contractors
Market cap ₹932 Cr · ROCE 37.1%
Sales+38%
Profit+55%
Margin19.5%was 14.3%
P/E7.9
9
Rubicon ResearchPromoters −8.51%
Market cap ₹26,660 Cr · ROCE 28.4%
Sales+52%
Profit+96%
Margin24.2%was 22.4%
P/E92.5
10
Krishna DefencePromoters −4.68%
Market cap ₹1,814 Cr · ROCE 31.1%
Sales+56%
Profit+120%
Margin26.9%was 19.0%
P/E36.8
11
Kanohar Electricals
Market cap ₹7,523 Cr · ROCE 54.3%
Sales+103%
Profit+140%
Margin28.3%was 22.8%
P/E51.6
12
Valiant Communications
Market cap ₹1,851 Cr · ROCE 37.7%
Sales+39%
Profit+65%
Margin42.7%was 34.4%
P/E68.0
13
Inventurus Knowledge Solutions
Market cap ₹29,248 Cr · ROCE 31.5%
Sales+21%
Profit+28%
Margin32.4%was 32.1%
P/E38.3
14
Borana Weaves
Market cap ₹549 Cr · ROCE 32.5%
Sales+24%
Profit+35%
Margin25.6%was 21.2%
P/E8.0
15
Atlanta Electric
Market cap ₹12,220 Cr · ROCE 45.3%
Sales+48%
Profit+50%
Margin16.5%was 15.5%
P/E56.0
16
Trent
Market cap ₹1.61 lakh Cr · ROCE 28.3%
Sales+22%
Profit+23%
Margin18.0%was 16.9%
P/E84.0
17
Market cap ₹32,778 Cr · ROCE 31.6%
Sales+43%
Profit+73%
Margin40.3%was 31.1%
P/E74.6
18
Hexagon Nutrition
Market cap ₹665 Cr · ROCE 22.2%
Sales+60%
Profit+64%
Margin12.1%was 12.0%
P/E16.8
19
SJS Enterprises
Market cap ₹6,694 Cr · ROCE 28.6%
Sales+24%
Profit+57%
Margin28.6%was 26.7%
P/E35.1
20
Silver Touch
Market cap ₹1,492 Cr · ROCE 29.8%
Sales+19%
Profit+75%
Margin20.5%was 16.1%
P/E31.6
Show all 62
21
Lumax Auto Technologies
Market cap ₹13,786 Cr · ROCE 21.2%
Sales+35%
Profit+58%
Margin13.5%was 13.4%
P/E37.2
22
BCC Fuba India
Market cap ₹702 Cr · ROCE 19.2%
Sales+63%
Profit+192%
Margin23.9%was 16.0%
P/E83.3
23
Fredun Pharma
Market cap ₹2,341 Cr · ROCE 21.5%
Sales+90%
Profit+95%
Margin14.4%was 14.2%
P/E52.7
24
KMC Speciality Hospitals
Market cap ₹2,420 Cr · ROCE 26.2%
Sales+38%
Profit+120%
Margin31.0%was 24.7%
P/E43.4
25
Aditya InfotechPromoters −2.91%
Market cap ₹46,739 Cr · ROCE 28.6%
Sales+90%
Profit+332%
Margin14.5%was 8.2%
P/E97.9
26
Coforge
Market cap ₹90,606 Cr · ROCE 23.5%
Sales+54%
Profit+67%
Margin19.8%was 18.9%
P/E41.7
27
Kwality Pharma
Market cap ₹3,606 Cr · ROCE 24.1%
Sales+46%
Profit+115%
Margin25.3%was 21.7%
P/E44.2
28
NDR Auto ComponentsPromoters +0.23%
Market cap ₹1,535 Cr · ROCE 22.2%
Sales+20%
Profit+21%
Margin11.4%was 10.7%
P/E23.5
29
Chandan HealthcarePromoters −2.41%
Market cap ₹575 Cr · ROCE 23.3%
Sales+19%
Profit+30%
Margin24.2%was 20.4%
P/E21.9
30
Radico Khaitan
Market cap ₹54,757 Cr · ROCE 24.1%
Sales+17%
Profit+66%
Margin20.5%was 15.9%
P/E68.2
31
Goldiam International
Market cap ₹4,301 Cr · ROCE 25.8%
Sales+42%
Profit+120%
Margin20.3%was 17.9%
P/E20.4
32
R R KabelPromoters −2.05%
Market cap ₹23,251 Cr · ROCE 28.1%
Sales+52%
Profit+55%
Margin8.6%was 8.1%
P/E34.4
33
Bajaj AutoPromoters +0.94%
Market cap ₹2.84 lakh Cr · ROCE 28.2%
Sales+60%
Profit+62%
Margin19.5%was 18.0%
P/E21.7
34
Kusumgar
Market cap ₹5,622 Cr · ROCE 18.8%
Sales+94%
Profit+883%
Margin30.4%was 15.3%
P/E44.7
35
Glenmark Pharmaceuticals
Market cap ₹64,875 Cr · ROCE 39.8%
Sales+23%
Profit+86%
Margin20.0%was 17.8%
P/E20.8
36
Macpower CNC Machines
Market cap ₹1,948 Cr · ROCE 29.1%
Sales+40%
Profit+44%
Margin16.6%was 16.5%
P/E45.3
37
Market cap ₹25,275 Cr · ROCE 26.5%
Sales+119%
Profit+962%
Margin34.7%was 11.8%
P/E50.8
38
CARE Ratings
Market cap ₹4,996 Cr · ROCE 26.3%
Sales+20%
Profit+27%
Margin51.5%was 50.2%
P/E25.9
39
Tinna Rubber
Market cap ₹1,436 Cr · ROCE 22.5%
Sales+31%
Profit+45%
Margin18.8%was 17.9%
P/E21.4
40
South West Pinnacle ExplorationPromoters −3.11%
Market cap ₹572 Cr · ROCE 20.1%
Sales+53%
Profit+289%
Margin24.2%was 14.4%
P/E14.3
41
Nephrocare Health ServicesPromoters −5.53%
Market cap ₹6,180 Cr · ROCE 15.3%
Sales+24%
Profit+35%
Margin21.4%was 20.9%
P/E72.6
42
Solar Industries
Market cap ₹1.70 lakh Cr · ROCE 38.1%
Sales+70%
Profit+93%
Margin27.7%was 24.8%
P/E85.4
43
Action Construction Equipment
Market cap ₹11,845 Cr · ROCE 31.6%
Sales+20%
Profit+22%
Margin15.0%was 14.2%
P/E27.1
44
Shaily Engineering Plastics
Market cap ₹14,580 Cr · ROCE 30.3%
Sales+31%
Profit+63%
Margin32.8%was 28.7%
P/E71.6
45
Danlaw Technologies
Market cap ₹603 Cr · ROCE 27.6%
Sales+35%
Profit+71%
Margin13.4%was 12.7%
P/E23.7
46
Vijaya Diagnostic Centre
Market cap ₹14,890 Cr · ROCE 20.5%
Sales+23%
Profit+38%
Margin42.7%was 39.1%
P/E79.4
47
APL Apollo Tubes
Market cap ₹60,116 Cr · ROCE 31.8%
Sales+27%
Profit+27%
Margin8.3%was 8.1%
P/E45.9
48
KEI Industries
Market cap ₹36,058 Cr · ROCE 20.1%
Sales+39%
Profit+29%
Margin10.0%was 9.9%
P/E34.1
49
Emcure Pharma
Market cap ₹35,510 Cr · ROCE 24.0%
Sales+23%
Profit+40%
Margin20.6%was 19.8%
P/E34.5
50
Modern Insulators
Market cap ₹2,106 Cr · ROCE 19.3%
Sales+33%
Profit+94%
Margin16.9%was 9.1%
P/E22.4
51
Market cap ₹44,541 Cr · ROCE 21.0%
Sales+57%
Profit+81%
Margin34.2%was 32.5%
P/E48.6
52
NGL Fine Chem
Market cap ₹1,561 Cr · ROCE 16.7%
Sales+36%
Profit+115%
Margin14.5%was 7.8%
P/E30.9
53
Lodha Developers
Market cap ₹1.04 lakh Cr · ROCE 16.4%
Sales+18%
Profit+28%
Margin33.3%was 29.2%
P/E23.8
54
Aeroflex
Market cap ₹7,098 Cr · ROCE 18.9%
Sales+87%
Profit+157%
Margin24.3%was 23.3%
P/E79.3
55
Pearl Global Industries
Market cap ₹11,030 Cr · ROCE 19.9%
Sales+24%
Profit+51%
Margin10.7%was 9.2%
P/E35.2
56
Honasa Consumer
Market cap ₹14,414 Cr · ROCE 19.2%
Sales+27%
Profit+118%
Margin14.6%was 7.7%
P/E57.1
57
Marksans Pharma
Market cap ₹13,876 Cr · ROCE 18.8%
Sales+36%
Profit+170%
Margin25.3%was 16.1%
P/E26.9
58
Kingfa Science
Market cap ₹9,192 Cr · ROCE 23.2%
Sales+49%
Profit+102%
Margin16.1%was 12.5%
P/E40.7
59
Carysil
Market cap ₹2,735 Cr · ROCE 18.0%
Sales+15%
Profit+38%
Margin20.4%was 19.3%
P/E25.4
60
Ipca Laboratories
Market cap ₹48,909 Cr · ROCE 17.0%
Sales+21%
Profit+72%
Margin24.0%was 18.0%
P/E35.6
61
Apollo Hospitals
Market cap ₹1.21 lakh Cr · ROCE 17.4%
Sales+21%
Profit+34%
Margin15.5%was 14.6%
P/E57.7
62
Arisinfra SolutionsPromoters +2.11%
Market cap ₹1,138 Cr · ROCE 15.6%
Sales+37%
Profit+306%
Margin10.5%was 8.6%
P/E17.2

Sales and profit: the latest quarter against the same quarter a year ago. Margin: operating profit as a share of sales this quarter, with the same quarter last year under it (“was”), the comparison the margin check uses. Market cap and share prices are from the run date. A promoter tag means the promoters raised or cut their holding last quarter. Prices move every day; check the numbers on your own screen before you lean on them.

Found one you like?

Go one level deeper.

The screen finds candidates. These show you how to judge one.

Shown apart · 3 companies

Riding the cycle.

These pass every check too, but mainly because the price of what they sell — a metal, oil, gas — is high. When that price turns, their numbers turn with it.

1
Hindustan CopperPromoters −6.00%
Market cap ₹38,763 Cr · ROCE 42.4%
Sales+81%
Profit+163%
Margin54.2%was 41.1%
P/E32.0
2
Sambhv Steel
Market cap ₹4,487 Cr · ROCE 19.1%
Sales+44%
Profit+105%
Margin12.1%was 10.4%
P/E22.7
3
Antelopus Selan
Market cap ₹3,525 Cr · ROCE 19.9%
Sales+116%
Profit+385%
Margin68.8%was 53.4%
P/E19.0
From next Saturday

Three ways off the list.

Every week some companies will drop out. Why they left matters more than that they left, so we will tell you which way they went.

Lost an engineSales, profit or margins stopped rising. The most important exit to notice.
Priced for perfectionThe share price ran so far it now trades above 100 times its profit.
Caught in the noise filterDebt went up, cash dried up or promoters pledged more shares.

Common questions

What is a multibagger stock?

A stock whose price has multiplied several times over — a two-bagger has doubled, a ten-bagger has gone up ten times. The word comes from baseball, and the investor Peter Lynch made it popular.

How do you find a multibagger?

Nobody can know in advance which stock will multiply. What you can do is look for the signs the big winners usually showed early: sales growing, profit growing faster, margins widening, for years rather than one quarter — in a business that earns well on its money, isn't drowning in debt and turns its profit into cash. This page checks for exactly those signs.

Which are the best multibagger stocks in India right now?

Nobody can name tomorrow's multibaggers with certainty, and anyone who claims to is guessing. What this page shows is the honest next best thing: the Indian companies that show the signs past multibaggers had in common, checked against the same screen every Saturday, ranked by how well they earn on their money and how fast they have grown.

How are the companies picked?

Every company has to pass all 13 checks of the same screen, shown on this page word for word. Nobody adds or removes a name by hand. The only judgement call is moving companies that are rising with a commodity price into their own section.

Why are some companies ranked above others?

By one score: return on capital multiplied by three years of sales growth. Businesses that earn the most on their money and have grown the most come first.

What does 'riding the cycle' mean?

Metals, oil and similar companies pass the checks when prices for what they sell are high — their sales, profit and margins really are rising. But those prices turn, and the numbers turn with them. We show them separately so they are not mistaken for businesses growing on their own steam.

Why are banks and finance companies never on the list?

Lenders borrow money to lend it on, so their debt is always many times their equity, and growing lenders usually show negative operating cash flow as they lend more. They fail the debt, return-on-capital and cash checks by design. They need a different set of checks.

Why does a company leave the list?

Three ways. Lost a sign: sales, profit or margins stopped rising and it failed a check. Priced for perfection: the share price ran so far that it now trades above 100 times its profit. Caught in the sieve: debt went up, cash dried up or promoters pledged more shares.

Is this a list of stocks to buy?

No. The signs are common among past winners, but plenty of companies show them for a while and then stop. Read each company's own results and reports, and decide for yourself.

Request a company
One level deeper · by email

Get the next one by email

A sector, read end to end, and the companies as they are published. Roughly monthly. Nothing else, and one click to stop.

Please read. This page is for learning. It shows the signs that many past multibaggers had in common and the companies that show them today; it does not predict which stocks will rise, and many companies that show these signs will not become multibaggers. Nothing here is a recommendation to buy, sell or hold any stock. Figures are from the screen run on 31 Oct 2026 and will have changed since. Check each company’s own results and reports, and decide for yourself — it is your money and your call.